BStreams

BStreams

Interactive, easy, responsive data visualization & analysis

1 follower

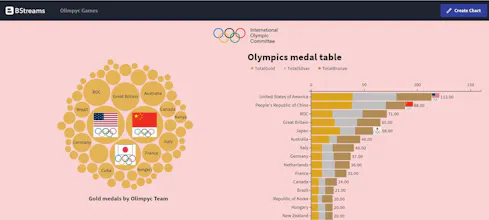
BStreams helps you manage your data and create interactive charts in minutes. No coding is required. Enrich your datasets with metrics and calculated fields of all kinds and consult the DataHub with private and public data daily updated by our team.
BStreams gallery image
Free
Launch tags:Design Tools•Productivity•Analytics
Launch Team
Anima - Vibe Coding for Product Teams
Build websites and apps with AI that understands design.
Promoted

What do you think? …

Fiorella Napolitano
Hey everyone! Did you knew about https://bstreams.io/ yet? š—§š—µš—² š—½š˜‚š—æš—½š—¼š˜€š—² š—¼š—³ š—•š—¦š˜š—æš—²š—®š—ŗš˜€ š—¶š˜€ š˜š—¼ š˜€š˜‚š—½š—½š—¼š—æš˜ newspapers, bloggers, data journalists, researchers, and B-Corps during the important and, at the same time, complex process of communicating and visualizing data. Why you should give BStreams a try: š—œš—»š˜š—²š—æš—®š—°š˜š—¶š˜ƒš—² š˜ƒš—¶š˜€š˜‚š—®š—¹š—¶š˜‡š—®š˜š—¶š—¼š—»š˜€ š—§š—µš—² š—±š—æš—¶š—¹š—¹-š˜š—¼-š—°š—µš—®š—æš˜: allows users to link two or more charts and have a deeper level of analysis. During the editing of the bstream, linking charts take place dynamically in the front end, so it is not required to prepare a static data structure in the back end. š—§š—µš—² š—³š—¶š—¹š˜š—²š—æ š—½š—®š—»š—²š—¹: can be added to each chart. In BStreams, filters allow users to explore all the fields, even those not included in the chart but present in the original dataset. š——š—®š˜š—®š—›š˜‚š—Æ: a vast data library containing public and private datasets that can be used to create bstreams.Our data scientist team daily manages these datasets. Once published, public datasets will be automatically updated. š——š—®š˜š—® š— š—®š—»š—®š—“š—²š—æ: a back-end section where the user can store its private dataset, manage and enrich them by applying many formats and calculated fields. š—„š—²š˜€š—½š—¼š—»š˜€š—¶š˜ƒš—² š—Æš˜€š˜š—æš—²š—®š—ŗš˜€: the structure of a bstream is that of a grid of up to 3 columns and infinite rows in which the user freely arranges graphics, texts, and images. Users can manage the grid's width while its contents adapt reactively to the display device. Thanks to this structure, the bstreams adapt to dashboards, reports, tutorials, theses, articles and host any content the user wants to represent. Make your first data visualization and let me think what you think about it in the comments below! Good or bad feedback are welcome! :) You can also follow BStreams on Linkedin at https://www.linkedin.com/company...