Graphgpt - 2D, 3D, Stats & Econs Graphs
Graphgpt turns prompts into publish‑ready graphs.
3 followers
Graphgpt turns prompts into publish‑ready graphs.
3 followers
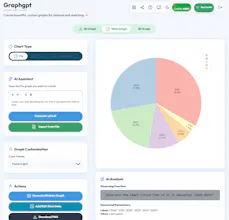
Traditional graphing calculators (like Desmos or GeoGebra) are powerful but have a steep learning curve. Furthermore, students, educators, and professionals must frequently use separate applications for 2D, 3D, and statistical graphing, creating a disconnected workflow. I developed Graphgpt, a web-based, AI-powered graphing calculator that unifies 2D, 3D, Econs, and statistical charting into a single, intuitive platform. Create 2D, 3D, and statistical graphs using natural language.