
Metoro
AI SRE that detects, root causes & auto-fixes K8s incidents
307 followers
AI SRE that detects, root causes & auto-fixes K8s incidents
307 followers
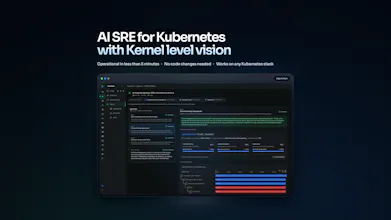
Metoro is an AI SRE for systems running in Kubernetes. Metoro autonomously monitors your environment, detecting incidents in real time. After it detects an incident it root causes the issue and opens a pull request to fix it. You just get pinged with the fix. Metoro brings its own telemetry with eBPF at the kernel level, that means no code changes or configuration required. Just a single helm install and you're up and running in less than 5 minutes.


Metoro
Hey PH! We're Chris & @ece_kayan , the founders of Metoro.
We built Metoro because dealing with production issues is still far too manual.
Teams are shipping faster than ever with AI, but when something breaks, engineers still end up jumping between dashboards, logs, traces, infra state, and code changes just to figure out what happened and how to fix it.
We started working on this back in 2023 during YC’s S23 batch, and learned a hard lesson from customers early on: generalized AI SRE doesn't work reliably for two reasons.
Every system is different. The architecture is different. Some teams run on VMs, some on Lambdas, some on managed services, some on Kubernetes, others on mixtures of all of them.
On top of that, telemetry is usually inconsistent. Some services have traces, some don’t. Some have structured logs, some barely log at all. Metrics are named differently everywhere.
This means that teams need to spend weeks or even months generating system docs, adding runbooks, producing documentation and instrumenting services before the AI SRE can be useful. That wasn't workable.
So we took a different approach.
With Metoro, we generate telemetry ourselves at the kernel level using eBPF. That gives us consistent telemetry out of the box with zero code changes required. No waiting around for teams to instrument services. No huge observability blind spots.
And because Metoro is built specifically for Kubernetes, the agent already understands the environment it’s operating in. It doesn’t need to learn a brand new architecture every time.
The result is an AI SRE that works out of the box in under 5 minutes.
We automatically monitor your infrastucture and applications, when we detect an issue we investigate and root cause it. When we have the root cause, we automatically generate a pull request to fix it, whether that's application code or infrastructure configuration. Detect, root cause, fix.
We’re really excited to be launching on Product Hunt today 🚀
We’d love for you to check it out, try it, and ask us anything. Whether that’s about Metoro, Kubernetes observability, or AI in the SRE space.
@ece_kayan @chrisbattarbee
I’ve been burned by 'AI SRE' promises before, but your approach to the data problem (eBPF) makes this actually feel technically grounded.. Really great to see
SellerClaw
@ece_kayan @chrisbattarbee eBPF is the part that made me stop here. Most tools in this space sound great until the data gets patchy. Starting with your own telemetry makes the whole thing feel a lot more believable.
How often are teams merging the PR as is?
Metoro
@ece_kayan @artem_kosilov Hey Artem!
Thanks!
So based on our tracking the PR (generated as is with follow ups on the PR itself) is around ~60%.
That being said, we know that people take the generated PR and open a new one themselves with that as the basis and they iterate on it themselves (which we don't have good metrics for right now as its separated from the initial PR that we create)
@ece_kayan @chrisbattarbee Congratulations, quick quest: What's one real-world production incident where eBPF telemetry uncovered a root cause that traditional dashboards/logs missed entirely?
Metoro
@ece_kayan @swati_paliwal We have quite a few examples of this but one that springs to mind is when a customers application was making requests via a subprocess (curl) and these requests were failing. Normal tracing instrumentation would never catch these requests as they would need to instrument curl directly, whereas with ebpf, we see those failures at the kernel level so it was a super easy spot
@ece_kayan @chrisbattarbee The idea is solid, but infra issues are rarely clean or isolated. but how does this deal with noisy signals or multiple cascading failures instead of a single root cause?
@chrisbattarbee @xavair
Great question :)
For noisy signals problem:
Metoro uses the eBPF-generated telemetry, so it is less dependent on inaccurate instrumentation that could cause noisy signals and then checks whether the telemetry actually lines up with the code path involved.
That helps filter out most misleading signals. A good example is requests surfacing as 500s when the underlying code path actually shows it should have been a 4xx.
We use also anomaly detection so persistent background noise does not mask new regressions, like a new error pattern after a deploy or a new endpoint suddenly throwing 5xxs.
For cascading failures
We do not force everything into one root cause. In fact, for cascading failures, its very possible that multiple multiple investigation agents are spawned across the affected paths. They all follow the dependency graph from eBPF generated traces and investigate each branch using traces, logs, metrics, k8s state, deploy/config diffs, and memory (what it already knows about that services behaviour). That lets us separate the first real failure from the downstream.
If there is a clear initiating fault, we identify it. If there isn’t, we surface the causal chain and candidate failure points with evidence
Where is telemetry data stored when using Metoro (cloud vs self-hosted)?
Do you support running on Azure Kubernetes Service (AKS), and are there any limitations?
Metoro
@anil_yucel1
Hey Anil :)
So we offer three distinct hosting options:
Metoro Cloud - Fully managed by Metoro, Metoro manages the infrastructure in our environment. Telemtry data is stored in our cloud environment
BYOC (Bring Your Own Cloud) - Managed by Metoro, hosted in your cloud - in your case in your Azure account. Telemetry data is stored in your cloud environment in buckets that you own but Metoro operates (Azure Blob Storage in your case)
On Prem - Fully managed by you, we just provide support. Telemetry data is stored wherever you choose to host Metoro, we support cloud based storage options like s3 and Azure blob storage or disk based solutions too (SSDs are recommended)
Yep we fully support AKS, no limitations!
@chrisbattarbee
Can you clarify what “Metoro Cloud” consists of from an architectural perspective?
Specifically, where is it hosted, how data is transmitted and stored, and what components run in our cluster vs your cloud?
Metoro
@anil_yucel1 For sure
So the below diagram is taken from our docs at https://metoro.io/docs/getting-started/architecture
In your cluster
Metoro Node Agent - this extracts data from running containers via ebpf programs and other methods. It them takes that data and converts it into OTEL compliant data internally. That data is then sent via HTTP to the metoro exporter.
Metoro exporter - This is a stateless component that is responsible for taking telemetry data from any source and forwarding it to our backend in the cloud. The communication between the exporter and our backend is HTTPS. The http request is sent over a secure TLS connection.
In the cloud
Our ingester service receives those HTTPS requests and writes all observability data to the long-term backend storage: currently ClickHouse. The connection between the ingester and clickhouse is also over TLS.
Clickhouse, clickhouse is the current backend that we use to store observability data and the data is encrypted at rest.
The apiserver serves requests from clients (like your browser) or the agents we run. Connections to the browser are via TLS over HTTPS and the apiserver communicates with clickhouse over TLS
Hope that clears things up!
The way you approached this with setting up consistent telemetry as a first step makes this very promising.
I wonder if I can also use it to monitor some longer term trends in the metrics?
Metoro
@alibi_yeslambek For sure.
So by default the AI SRE sets up anomaly monitors on things we classify as golden metrics (think RED metrics and some infrastructure level signals). The anomaly monitors there run at different timescales, we have O(minutes), O(days) and O(weeks) right now. If anything breaches those thresholds then the agent will investigate, determine whether or not its noise and ping you if it actually is a problem.
You can also specify metrics that you want to have monitored manually if that's more your style too
Looks promising!! Can't wait to try this out. Quick question: If eBPF can see all requests in the cluster, how do you avoid accidentally collecting or shipping sensitive data from them? That’d be one of my first concerns in prod.
Metoro
@abin_paul1 Hey Abin, good question. So for each protocol we only pull out known non-sensitive parts of the request.
As an example, think http.
We dont export all headers for example or the body, but we do export URL parameters, path, url etc
Effective each protocol has a default allow list which you can augment yourself.
love the s23 batch background. it’s clear you guys learned a lot from the 'generalized ai' failure. how does the agent handle 'false positives' in a noisy environment where some services are naturally spikey?
the autonomy angle is appealing. my concern is auto-PRs that fix one incident and quietly regress something else - without a human gate somewhere, that's a hard failure category to catch.
Metoro
@mykola_kondratiuk For sure we definitely agree with you. That's one of the main reasons behind using PRs in the first place, before the PR is merged you should definitely be reviewing or using tooling to help verify the PR (like all the other PRs!)
PR gates help, but agents generating 10+ PRs daily means review fatigue sets in fast.
Metoro
@mykola_kondratiuk For sure, I think at the end of the day you're right and it's not totally a solved problem across the industry. Agents are generating PRs at an unprecedented rate, how do we deal with that?
We try to help with post deployment verification, Metoro will post on your PRs if there's error upticks or problems associated with it. And from the review side, you can configure a priority level where Metoro only creates PRs for a certain priority or higher.
But I think you're definitely right.
rate control is the only real answer - treat agent PRs like output from a junior team. review bandwidth becomes the constraint fast.
Does it work well with many scheduled jobs/tasks for which the code is in a large monorepo?
Metoro
@alexander_zakon Yes!
So each k8s cronjob gets mapped to a service internally in Metoro. Then each service is assigned a codepath which is a combination of repository and source path. It looks something like:
Metoro discovers those automatically by itself by comparing emitted logs, profiling information etc but you can also set it manually by setting an annotation on the pod or the CronJob itself https://metoro.io/docs/integrations/github#option-1-using-kubernetes-annotations-recommended