Launching today

Conduit
The local MCP gateway that cuts tokens ~90%
112 followers
The local MCP gateway that cuts tokens ~90%
112 followers
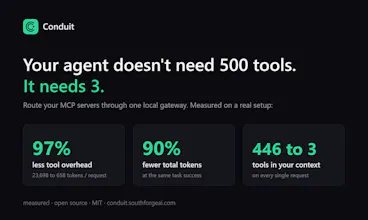
Every MCP server dumps its whole tool list into your agent's context on every request. 3 servers cost ~24k tokens before you even say hi. Conduit routes them through one local gateway that exposes 3 meta-tools the agent searches on demand. Measured: 97% less tool overhead per request, ~90% fewer tokens, same task success. Works on one AI tool or five, cloud or local. Keys in your OS keychain, live toggles, no cloud, no account. Free and open source.


Conduit
Hi Product Hunt 👋
I'm Tyler, the maker of Conduit
I kept adding MCP servers to my AI tools, and the more I added, the slower and less reliable my agents got. The reason surprised me: every MCP server loads its entire tool list into the model's context on every single request. On my setup that was roughly 24,000 tokens of tool definitions sitting in context before I'd typed a word, and the model discards all of it between calls, so you pay for it again on the next one.
Conduit fixes that. It's a local-first gateway that sits between your AI tools and your MCP servers. Each client connects to it once, and instead of exposing every tool, it exposes three meta-tools the agent searches on demand. The full catalog is still available; it just no longer sits in context on every request.
I benchmarked it on a real setup: 97% less tool overhead per request, around 90% fewer total tokens, at the same task success rate. The full method and numbers are in the repo.
This helps no matter how you work. On cloud models, those tokens are your bill. On local models, the tool definitions eat your context window. Either way, you stop paying for tools the agent never calls.
A few things I focused on:
• API keys stay in your OS keychain, never in a config file
• Nothing phones home, it's fully local-first
• Works with 17 clients today across Windows, macOS, and Linux
• Free and open source
I'd love your feedback, especially on which MCP servers or clients you'd like supported next. Thanks for checking it out 🙏
Foyer
The 90% token reduction claim is the part I want to understand better. Is that coming from stripping context on the client side before it ever hits the model, or are you doing something smarter like caching tool descriptions and only sending diffs when the schema hasn't changed? Those are pretty different architectures with pretty different failure modes. Also curious how Conduit handles situations where the MCP server schema changes mid-session, since a stale cached description passed to the model could cause subtle tool-call errors that are annoying to debug.
Conduit
@fberrez1
Neither, actually, it's closer to retrieval than stripping or diffing. The gateway is itself the MCP server your client connects to, and it only ever advertises 3 meta-tools (search / call / status). So the model never receives the full catalog in the first place, nothing to strip client-side, no diff to send, because the full set of definitions was never in context to begin with. When the model needs something it calls the search meta-tool, gets back just the matching schemas, and calls through. Basically RAG, but for tools.
On the stale-schema risk, good instinct, that's the real failure mode with any tool caching. Honest status:
The cache refreshes on config changes (toggling/adding/removing a server, auth), and the gateway emits tools/list_changed upstream when it does.
It does NOT yet auto-refresh when a downstream server changes its own schema mid-session, those notifications are currently skipped. Real gap, and it's the obvious next step: listen for the downstream's tools/list_changed, re-fetch, refresh, propagate up.
Two things shrink the blast radius in the meantime, and they fall out of the lazy approach for free:
The model retrieves a schema right before it calls, not once at session start, so what it gets is as fresh as the last rebuild instead of stale for the whole session.
The call routes live to the server, which validates against its current schema. A stale description doesn't silently misbehave, it surfaces as a normal tool error from the real server, annoying but debuggable, not mysterious.
So not bulletproof against mid-session schema churn yet, but the architecture makes the window smaller and the failures louder than loading everything up front.
The token overhead problem is real - 24k tokens before the agent does anything is a genuine waste. My question is about the 'same task success' benchmark scope. Tasks like 'list the projects in Vercel' are the easy case for lazy discovery because the right tool is obvious from the description. What happens on tasks where the agent needs to plan across tools it doesn't know upfront - say 'debug why my payment flow is broken' across Stripe, your DB, and Vercel logs simultaneously? Does the search-first approach still converge reliably, or does it end up doing multiple search round trips that eat back some of the savings?
Conduit
@galdayan This is the sharpest version of the question, and you're right, the benchmark is the easy case. Single-tool tasks where the description basically names the tool are where lazy discovery looks best, and I won't pretend the 90% transfers cleanly to "debug the payment flow across Stripe, the DB, and Vercel logs."
On tokens: the round-trips eat back some of the savings, but usually not all. Each search returns a bounded, ranked set of schemas, not the whole catalog, so a handful of searches costs a few thousand tokens total, versus flat re-sending all 62 definitions every single turn. On a multi-turn task the per-turn savings still compound; the round-trips shave the margin, they don't erase it. What does erase it is a task that needs most of the catalog, at that point you're paginating the whole thing in and lazy stops helping.
On convergence, that's the real open question, and the honest answer is I haven't benchmarked it. The cost I won't wave away: when the agent can't see the full menu, it loses awareness of what's even possible, which bites hardest on exactly the planning-heavy "I don't know what I'll need yet" tasks you're describing. Search ranking is built to help (one query for "payment" should surface the related Stripe/DB/logs tools together to cut round-trips), but "built to help" isn't "measured."
So the honest scope: clear win when a task uses a small slice of a big catalog (most tasks), genuinely open for hard multi-tool planning. That's what I want to measure next, and if search-first hurts convergence there, the answer is probably a hybrid, a small always-loaded core plus lazy for the long tail, not forcing one mode on everything. Great question!
The tool list bloat before you even start a task is so real, glad someone is fixing it at the gateway layer instead of inside each agent. Does it handle servers that change their tool list at runtime, or is the catalog cached per session? Congrats on shipping.
Conduit
@i_sanjay_gautam
Thanks! The gateway layer was the whole bet: solve it once and every client benefits, instead of each agent reinventing it.
On the catalog: not per-session, it's a live cache. The gateway watches its config and rebuilds (re-fetching tools, re-emitting tools/list_changed to your client) whenever you toggle, add, remove, or auth a server.
Honest gap: if a server changes its own tool list at runtime with no config change, Conduit doesn't auto-detect that yet, it skips the server's tools/list_changed notification today, so that case stays cached until the next rebuild or a restart. Handling that notification is the clear next step.
What softens it: with lazy discovery the agent searches for a tool right before calling it, so it's working from the latest rebuild rather than a session-start snapshot, and the call routes live, so a tool that's actually gone fails loudly instead of silently.
Tendem by Toloka
Hey, congrats!
Could you please elaborate on benchmarking the solution - how did you measure the success rate, and what benchmarks did you use?
Conduit
@perrymason
Thanks! Happy to break it down, and upfront: it's a small, honest benchmark, not a standardized suite.
Setup: 3 real MCP servers (Stripe, Neon, Vercel), 62 tools total, driven by a local model (Qwen2.5-7B via LM Studio). Tasks were simple real ones like "list the projects in Vercel" that force the agent to find and call the correct tool. Each ran in both modes, all 62 tools loaded vs Conduit's 3 meta-tools, 5 runs each, median reported.
Two numbers, two measurements:
The 97% less tool-def overhead per request is deterministic, just counting tokens in the advertised tool list (62 schemas = ~24k tokens vs ~660 for 3 meta-tools). No model involved, so no noise.
The ~90% fewer total tokens and the success rate come from running the agent loop. Success = the agent found and called the right tool and completed the task, scored pass/fail per run. Lazy mode matched all-tools-loaded on success while using ~90% fewer tokens. And at a tight context budget (8k), the full list actually overflowed before the first prompt, so lazy completed tasks the flat setup couldn't even fit.
Honest caveats: it's a handful of tasks on a small catalog, one local model, not a big eval. The harness is in the repo (benchmark/), so you can point it at your own servers, tasks, and model, that's the part worth trusting more than my numbers.
This is exactly the kind of agent-infra pain that is easy to miss until it becomes a bill or latency problem. The tool-list bloat detail is useful because it names a concrete failure mode, not just “too many tokens.” Curious: do you see teams wanting per-server/per-tool usage visibility too, or is the gateway meant to stay invisible once configured?
Conduit
@jaemin_song
Great question, and it's a both/and. The gateway is invisible in the request path, your client just talks to Conduit and never sees the routing, but because every call funnels through one place, that same chokepoint is where the visibility comes from for free.
So per-server and per-tool visibility is already in today: the Activity view logs every call and breaks it down by server and by tool, with volume, error rates, and latency (avg + p95). That came straight out of my own debugging, when an agent "mysteriously" stalls, you want to see exactly which server's tool errored or went slow.
Where it's thin right now is the team dimension. That audit log is local, per machine. Shared/aggregated visibility across a team (plus audit export, central policy) is the natural next layer, and honestly where I'd expect a paid tier to sit, but I'm holding off on the team backend until there's real pull for it. The local version is the validator.
So: invisible in the path, intentionally visible in the dashboard, and the team view is the obvious next step once the demand's there.
LottieFiles
~90% token cut on MCP is a big claim and a real pain point. is that from trimming tool schemas/results or actual response compression?
Conduit
@reallynattu
Great question, and it's neither exactly. It's lazy discovery: the gateway advertises 3 meta-tools (search / call / status) instead of your whole catalog. The agent searches for the tool it needs and pulls just that schema in on demand, so the full set of tool definitions never sits in context.
So it's not schema or result compression, it's keeping the bulk of the catalog out of context until it's actually needed. The per-request number is the tool-def overhead (62 tools = ~24k tokens of schemas, vs ~660 for 3 meta-tools); the ~90% over a full task is that amortized across an agent loop, where the whole list would otherwise re-send every turn.
Honest scope: it's tool definitions we cut, not result payloads, so a server that returns a giant blob is unchanged. Full method's in BENCHMARK.md if you want to pick it apart.