Badges


Maker History

Forums


Introducing Seasonality; Swing Backtesting by NineThirty AI
Most retail swing traders rely on pure technical analysis - a breakout, a moving average bounce, or a classic chart pattern. But even the cleanest chart setup can disintegrate if you re blind to a stock s underlying seasonality and historical drawdowns.
Traders often talk about seasonal edges, but almost no one actually validates them. NineThirty AI's Seasonality changes that by bringing institutional-grade historical backtesting and seasonal metrics directly into a single, high-fidelity screener.
How It Works Under the Hood:
Equity research and analysis shouldn't require multiple tabs
One of the problems Ninethirty is solving: equity research and analysis shouldn't require six tabs and a prayer. Screener in one, news in another, backtesting in a third, fundamentals and technicals scattered across two more-by the time you've stitched it together, the signal's gone cold.
Ninethirty collapses that into one AI-native workflow: describe your edge in plain English and screen on fundamentals, technicals, price action, and sentiment simultaneously, stress-test it (validate the conditions on historical data) instantly with one-click backtesting up to 500 candles, and cut through the noise with a filtered, signal-only news feed.

Quick one. This isn't just a feature, it's a decision
Most screeners hand you a blank canvas and 40 filters. That's great if you already know what you're looking for. Most traders don't. That's why so many powerful tools get opened once and never used again.
So with ninethirty, we took a different approach.
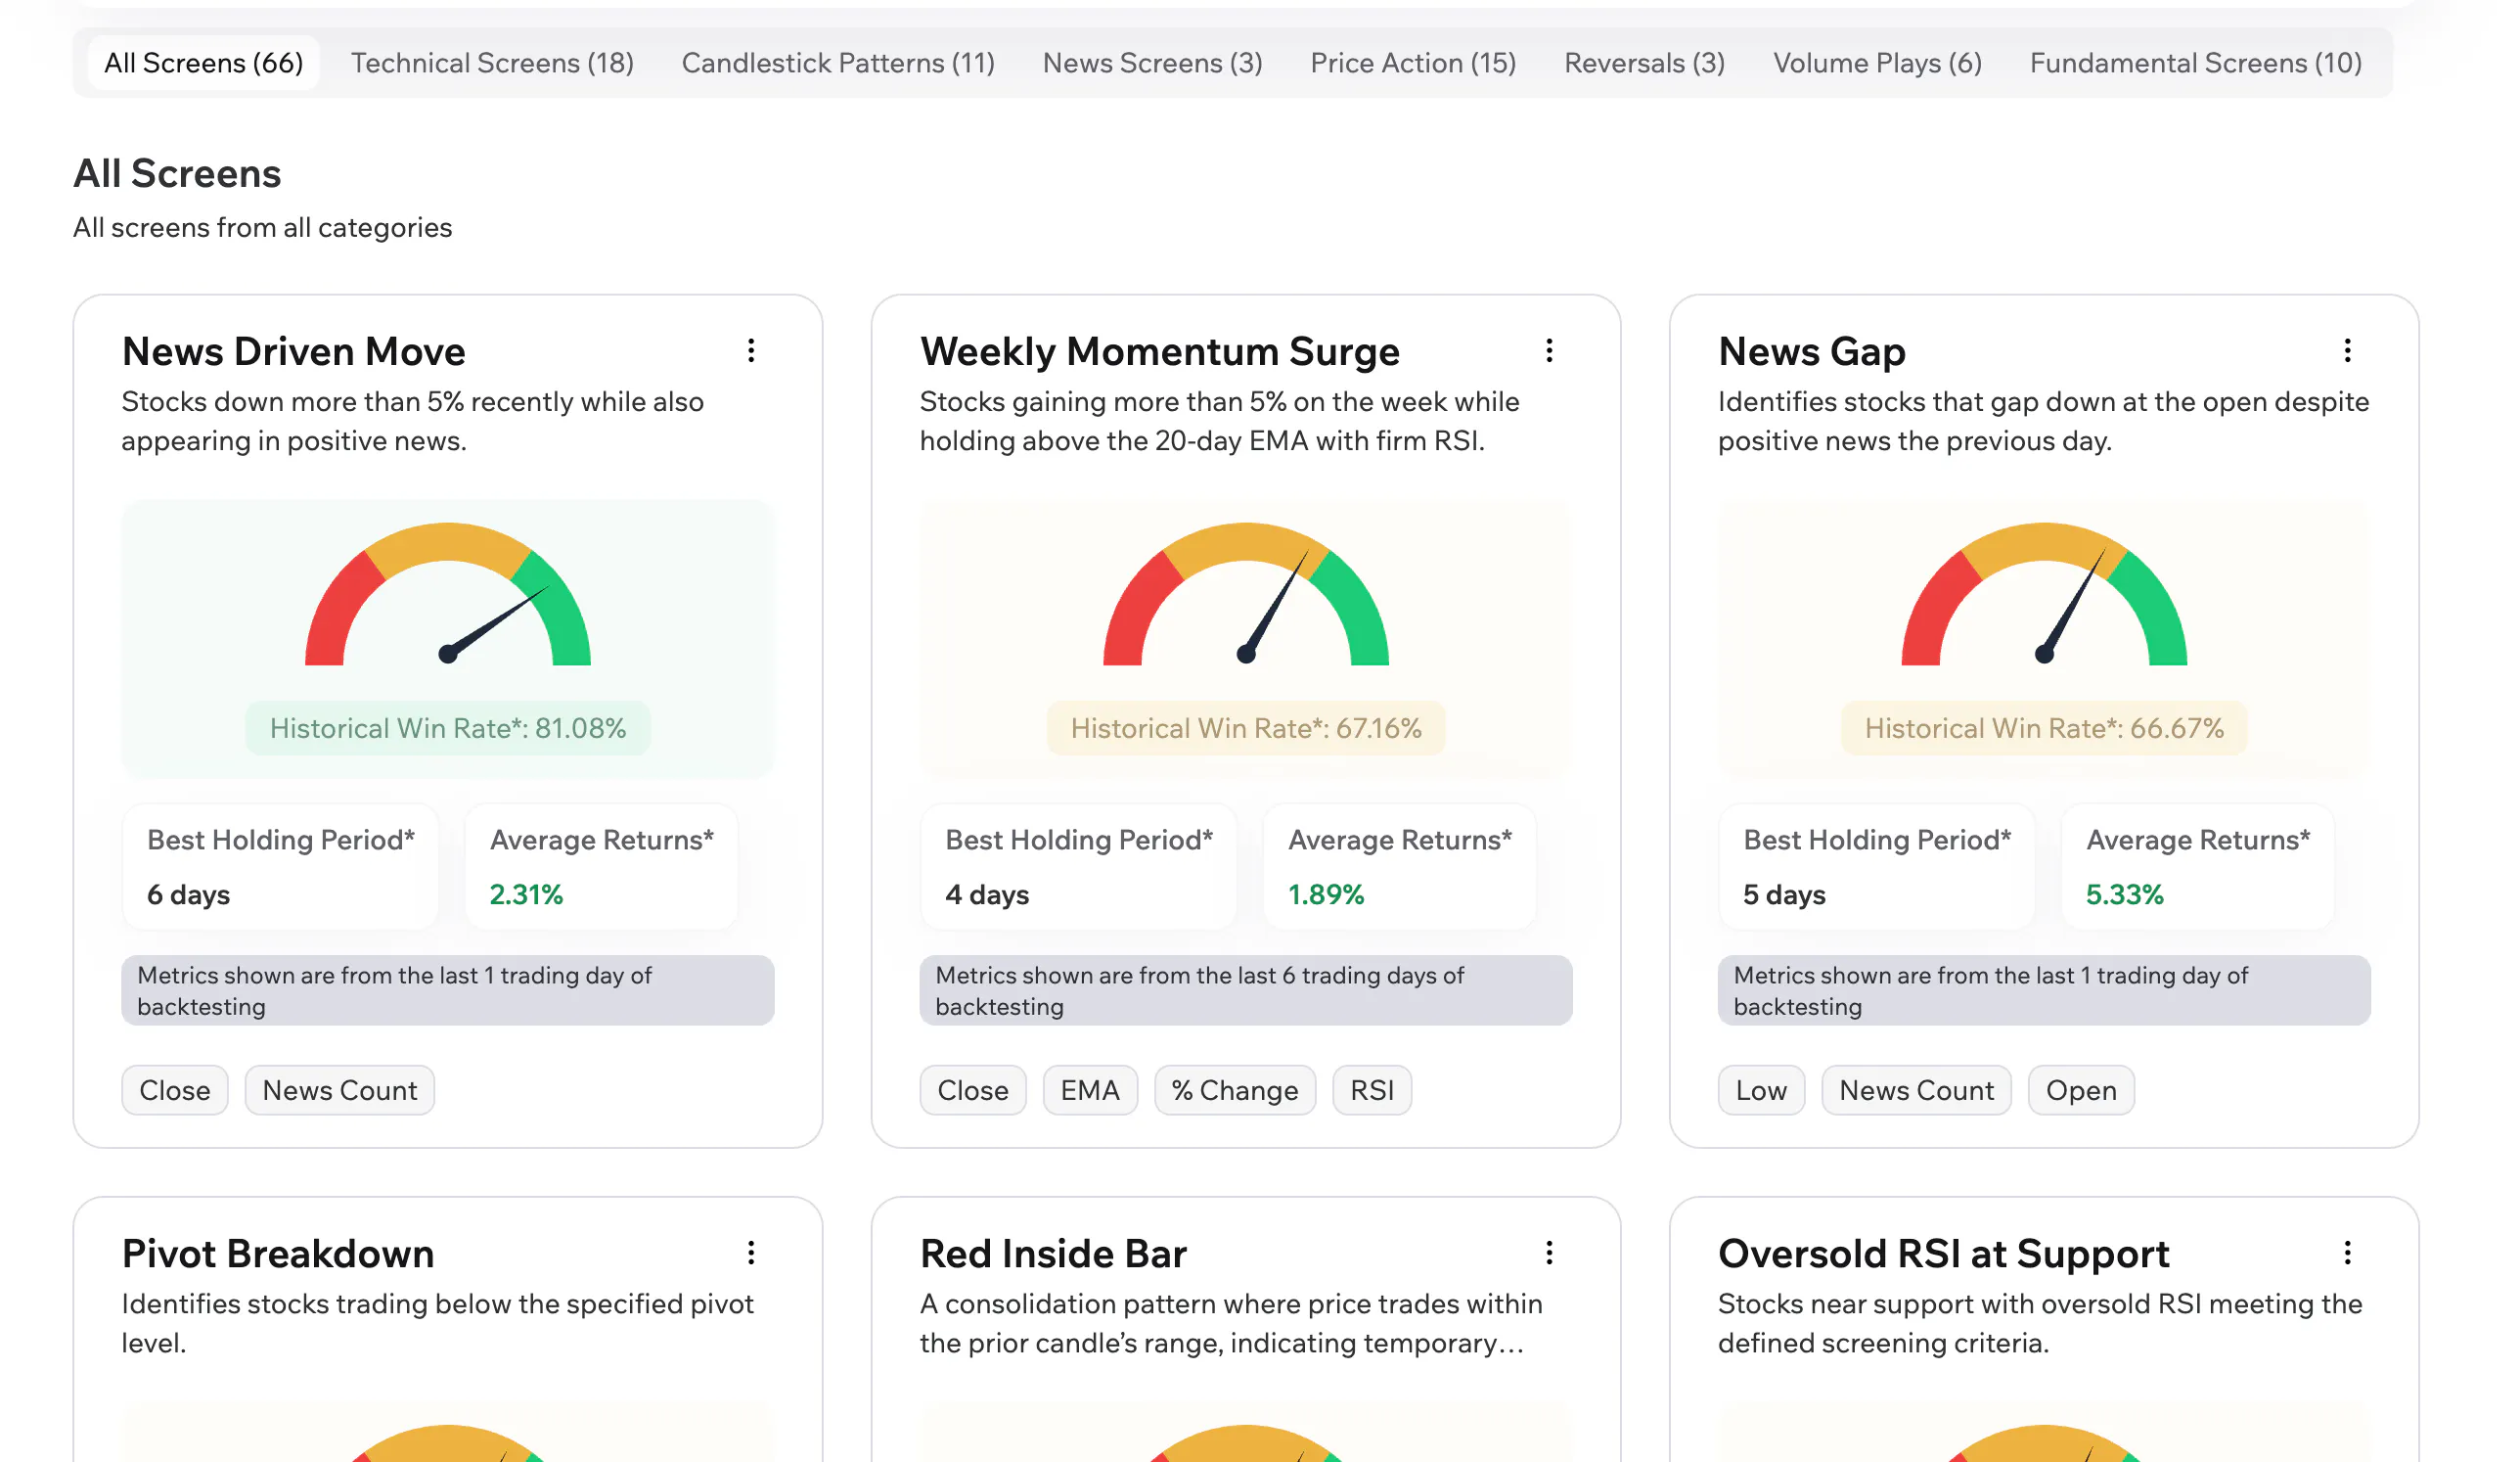
It comes with 66 predefined public screens across Technical, Candlestick Patterns, News, Price Action, Reversals, Volume, and Fundamentals.
These aren't just filter combinations. They're actual trading ideas like Oversold RSI at Support, Red Inside Bar, or News Gap, which finds stocks that gap down despite positive news the previous day.
The best part? You simply click a screen, and it runs instantly.
Before you even look at the results, you can already see how that strategy has performed historically. Every public screen comes with its own backtest showing the historical win rate, best holding period, and average returns.
For example:
Weekly Momentum Surge: 67.16% win rate with a 4-day holding period.
News-Driven Move: 81.08% win rate.
Note: Not a claim
And if you want to go beyond the default scan, you can. Change the timeframe, tweak the conditions, and build on top of it. The same screen that gets you started also becomes your workspace.
If you've ever opened a screener, felt overwhelmed by endless filters, and closed the tab, this is built for that exact moment.