
Rhubarb
Build custom interactive data visualizations with AI
7 followers
Build custom interactive data visualizations with AI
7 followers
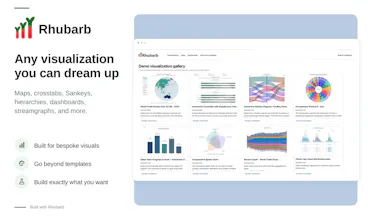
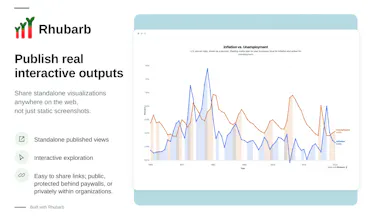
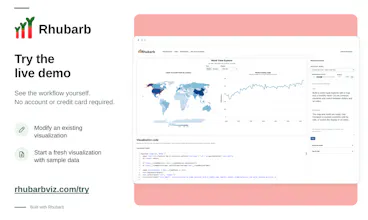
Rhubarb turns connected data into highly custom interactive visualizations with an AI assistant that writes the SQL and JavaScript while keeping the code visible and editable. Unlike chart generators or fixed dashboard tools, Rhubarb produces functioning, publishable visualizations that stay connected to their data, with hosting, sharing, access controls, and continued AI-assisted editing built into the same workflow. Skip the point-and-click interface—just ask for what you want to see.




Free Options
Launch Team / Built With


CloudflareStill paying to deploy your apps? Try Cloudflare Workers for free
Promoted
Incredibly fast way to visualize and glean insights. The AI is powerful, being able to iterate unlocks exploring multiple views really quickly.
Has basically unlocked doing exploratory analyses that I wouldn’t have known to ask for or known it was worth a data analyst‘s time.
Been using it to play with our global database and prompting the AI both in terms of adjusting how data is being used and visual representation. This tool is fun and motivating. 📈