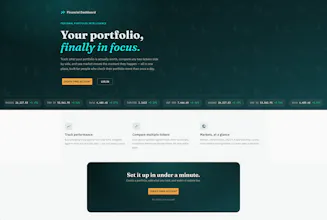
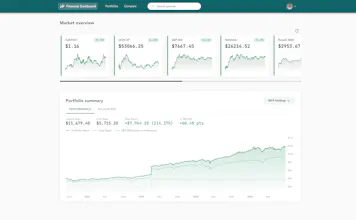
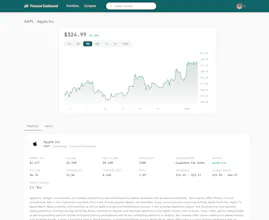
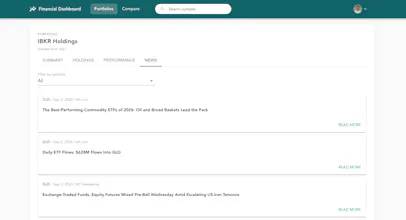
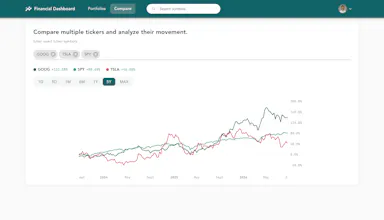
A fintech dashboard that started as my master's thesis in 2020 and is now a real, deployed project. Track market data and visualize your own spending with full control over your data, no third-party fintech app required. Backend: Flask + PostgreSQL for core data, Redis for caching and sessions. Aggregates prices from multiple providers (yfinance, Alpha Vantage, IEX) with automatic fallback for reliability. Frontend: Vue.js / Vuex. Built solo end to end. Open source.
Hey Product Hunt 👋
Back in 2020 I built this as my master's thesis. The goal was mainly academic - I wanted to build a real full-stack app, not just a backend exercise, and I wanted to work with multiple external data sources instead of one clean API. It sat mostly untouched for years while I worked as a backend engineer (Django, FastAPI, Flask) at a few different companies.
This year I revived it (Using only free resources): moved the deploy target to Render, Neon (DB), and Upstash (Redis), cleaned up the data layer, and got it running live again at finance.puljic.ch.
A few things I'm proud of under the hood:
Market data aggregated across multiple providers (yfinance, Alpha Vantage, IEX) with automatic fallback, so one provider going down doesn't take the dashboard with it.
Redis for caching and session handling, cutting redundant calls to external APIs.
PostgreSQL as the single source of truth, simplified from an earlier version which also used MongoDB.
It's fully open source (MIT) — code's linked above. Would love feedback, especially from anyone who's dug up an old project of their own, or has thoughts on the backend architecture.