
Plenum Atlas
Interactive map dashboards from your CSV
1 follower
Interactive map dashboards from your CSV
1 follower
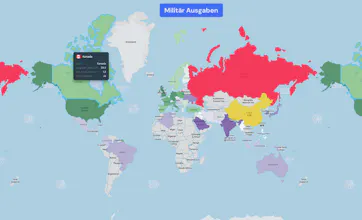
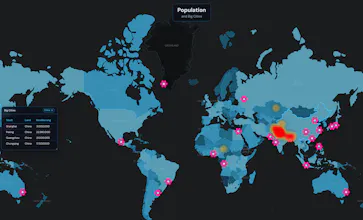
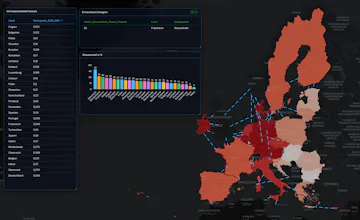
Plenum Atlas turns CSV or Excel files into interactive map dashboards. Drop your data, pick a region — your numbers appear on the map instantly. Click a country to filter tables and charts. 8 visualization types, 10 map styles, export to PowerPoint, PDF, Word, or standalone HTML. 100% local, GDPR-friendly, one-time purchase. Built for analysts and consultants who want map dashboards without Tableau or GIS.


Hi PH! I'm Stefan, indie dev from Germany.
Years ago I was a heavy user of a SAP plugin that let you build real interactive map dashboards. When it got discontinued, I kept missing it. So I rebuilt the concept from scratch, as a native Mac desktop app with no cloud and no subscription.
Drop a CSV or Excel file onto Plenum Atlas, pick your region column, and your data appears on a fully interactive map – choropleth, bubble, heatmap, hub & spoke, whatever fits. Click a country and the connected table and charts filter automatically. The map IS the dashboard.
The feature I'm proudest of: export your visualization as a standalone interactive HTML file. Send it by email, your recipient opens it in any browser, explores it without installing anything.
100% local – your data never leaves your device. One-time purchase, no subscription, GDPR-friendly out of the box.
Plenum Globe (the 3D sister app) is also on PH this week – two separate apps, not a bundle, pick whichever fits your data.
Would love your feedback and questions!