
Pandada AI
Build data wealth: Turns files into McKinsey-level insights
991 followers
Build data wealth: Turns files into McKinsey-level insights
991 followers
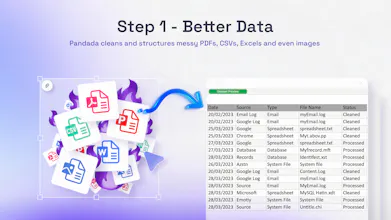
Pandada empowers both non-technical operators and data scientists to achieve data wealth. Move beyond "chatting" with data—Pandada turn messy csvs, pdfs, excels files, and even photos into downloadable and shareable McKinsey-level reports and presentations — so you can make better decisions grounded in data.




Free Options
Launch Team

AWS Startup AdvisorPersonalized AWS guidance that meets you where you’re already building
Promoted
Generating visualizations directly from the data is a huge win. Pandada saves me from constantly copying tables back into Excel just to make charts.
@huglemon I hear you. Moving stuff back and forth with Excel is a total time-sink. We basically built this to cut out that manual grind so you can just get the visuals you need without the headache. Good to know it’s hitting the mark for you.
@huglemon Thanks! Glad it saves you that extra step 🙌
Congrats! What I like about Pandada is that everything happens in one flow. You can work with raw data, structure it, and analyze it without switching tools.
@newt0n That "one flow" experience is exactly what we were aiming for. We really wanted to kill the friction of jumping between different apps just to get a simple analysis done. It’s awesome to hear that staying in one place is making your life easier.
@newt0n Thanks~One smooth flow is exactly the idea
@newt0n Appreciate it — one connected workflow is exactly what we’re building for.
Pandada handles document-based data surprisingly well. The structured output saves a lot of cleanup time and makes analysis much smoother.
@heal_yi Appreciate this. Turning document data into clean, structured output is a big part of what we focus on. Glad it made your analysis smoother.
The "Enhance the Prompt" feature basically wrote the query logic for me. 10/10 utility.
@wys1010 Love hearing this — that’s exactly what “Enhance the Prompt” is meant to do. Thanks for the 10/10.
Congratulations on the launch! Can this be integrated with Google Analytics? If so, it would be extremely helpful.
@stan_xu1 Thanks a lot! Direct Google Analytics integration isn’t available yet. Right now, teams typically export GA data and upload it into Pandada for analysis. Native integrations like this are something we’re actively exploring, especially based on requests like yours.
I like that Pandada handles the heavy lifting of data prep. It lets me focus on understanding trends instead of fighting with columns and rows.
@leah_leee Thanks — that’s exactly the idea. We want people spending time understanding trends, not wrestling with rows and columns.
After a brief trial, the chart effects are quite good and basically meet the requirements. I believe that with more interaction, I should be able to create charts that fully meet the requirements. Excellent!
@jerry_0201 Thanks for trying it out! Glad the charts met your needs. Appreciate the encouragement!