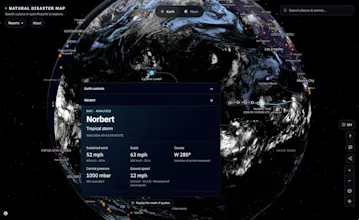
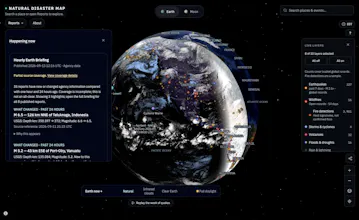
Quakes live on USGS, fires on FIRMS, cyclones on NHC. Natural Disaster Map puts them on one canvas. • Earthquakes, wildfires, storms, volcanoes, floods and droughts, live • Cyclone advisories and forecast tracks • Satellite and infrared imagery (GOES, EUMETSAT, NASA GIBS) plus 10m winds • Replay the last 24h, 3d or 7d at adjustable speed • Every event links to its source agency report; any view is shareable Free, no app.
What became possible in your product with Astra that was not practical before?
Maker
Astra made it practical to build NaturalDisasterMap.com as a real-time global disaster intelligence layer rather than a collection of separate maps. It helped turn fragmented, constantly changing data from different disaster sources into one coherent interactive experience: normalizing events, locations, severity, timestamps, and metadata while helping me rapidly build the infrastructure and visualization around them. What previously would have required a much larger engineering team and weeks of integration work could be designed, debugged, and shipped extremely quickly. The result is a single global interface where anyone can explore what is happening across the planet instead of hunting through disconnected government dashboards and data feeds.
Report
Maker
📌
Hey Product Hunt 👋
I built Natural Disaster Map because following a live event meant juggling five tabs: USGS for the quake, NASA FIRMS for the fire, the NHC for the cone, another app for radar, and news for context. In the middle of hurricane season that is a terrible way to see what is actually happening.
So I put them on one map. Earthquakes, wildfires, storms, volcanoes, floods and droughts, all pulled from the agencies that publish the data, with satellite and infrared imagery and 10m winds layered underneath. You can scrub the last 24 hours, 3 days or 7 days to watch a system develop, open any event for its source report, and share the exact view you are looking at as a link.
Two things I cared about while building it: it stays free and has no app install, and it never dresses up a guess as data. If an agency has not published it, it is not on the map. It is a situational-awareness tool, not an alerting service.
What I would love feedback on: which layers you would want next. Lightning, river gauges and air quality are the three I keep coming back to. And if satellite coverage looks thin where you are, tell me the region and I will dig into it.
— Parker