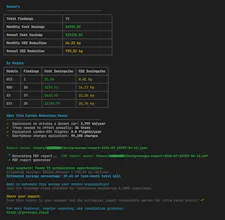
Cloud waste is the electricity bill no one reads. GreenOps Scan helps engineering teams quickly spot likely AWS waste without onboarding another SaaS tool first. Run one command: npx greenops-scan What you get: * local execution on your machine * read-only AWS API usage * credentials never leave your machine * JSON + PDF output with estimated monthly/yearly cost opportunity On one account, GreenOps Scan surfaced 130 issues and $2,209/month in savings.
No reviews yetBe the first to leave a review for GreenOps Scan
Maker
📌
Hey Product Hunt 👋 I’m the maker of GreenOps Scan.
I built this because teams often know their AWS bill is too high, but don’t have a fast, trusted way to see where waste is hiding at resource level.
GreenOps Scan is intentionally:
free
local-first
read-only
You can run it on a dev/sandbox account in minutes:
> npx greenops-scan
I’d love direct feedback on two things:
Which findings feel most actionable?
Where are the false positives or missing checks?
I’ll use launch feedback to prioritize the next checks and report improvements.
Report
Maker
How One AWS Bill Went From Almost $8,000 a Month Toward $6,000
Two real scans, eight weeks apart, on the same account
GreenOps Scan is a free, read-only CLI that finds wasted AWS resources from your terminal. You run npx greenops-scan against a read-only AWS profile, and it returns a list of idle or oversized resources with dollar estimates — no write access, no cloud uploads, no signup.
Cloud bills rarely jump overnight. They drift. A launch adds an oversized Fargate service. A prototype gets a managed database. An experiment ends, but the resources it created stay running. Buckets accumulate without a lifecycle policy because no one owns the cleanup decision. By the time the monthly total becomes uncomfortable, the waste is already spread across a dozen services.
This post is not a hypothetical write-up. It is two real GreenOps Scan reports, run eight weeks apart, against the same production AWS account. We are showing exactly what the scanner found, what the team changed between the two scans, and what AWS's own Cost Explorer forecast says is likely to happen next.
The account and the company behind it
The account belongs to a mid-sized software company that runs a mix of customer-facing services and internal platforms on AWS. Its stack is probably familiar if you work in a growing tech org: containerized services on ECS/Fargate, a DocumentDB cluster, ElastiCache, RDS, an Application Load Balancer, AWS Transfer Family, and the standard security and compliance tooling (GuardDuty, CloudTrail, Config, KMS, Secrets Manager). Nothing exotic, nothing hyperscale — just a working AWS account where a small platform team is keeping a lot of services running.
Like many teams, they do not have a dedicated FinOps person. Costs drifted as projects shipped, prototypes ran, and experiments ended. By the time the monthly bill became uncomfortable, the waste was spread across a dozen services, and no single Cost Explorer view showed the whole picture clearly.
When we ran the first npx greenops-scan, the account was already billing $7,726.20 for the month, with the two largest line items being ECS ($3,235.93) and DocumentDB ($1,506.78).
The account's real Cost Explorer history: a near-continuous climb from about $2,000/month in late 2023 to nearly $7,800/month by mid-2026. The last bar is AWS's own forecast (marked with ** and an 80% prediction interval) for the following month — not a confirmed result, but a trend AWS's own model expects given recent changes to the account.


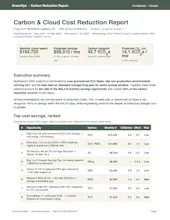

How One AWS Bill Went From Almost $8,000 a Month Toward $6,000
Two real scans, eight weeks apart, on the same account
GreenOps Scan is a free, read-only CLI that finds wasted AWS resources from your terminal. You run npx greenops-scan against a read-only AWS profile, and it returns a list of idle or oversized resources with dollar estimates — no write access, no cloud uploads, no signup.
Cloud bills rarely jump overnight. They drift. A launch adds an oversized Fargate service. A prototype gets a managed database. An experiment ends, but the resources it created stay running. Buckets accumulate without a lifecycle policy because no one owns the cleanup decision. By the time the monthly total becomes uncomfortable, the waste is already spread across a dozen services.
This post is not a hypothetical write-up. It is two real GreenOps Scan reports, run eight weeks apart, against the same production AWS account. We are showing exactly what the scanner found, what the team changed between the two scans, and what AWS's own Cost Explorer forecast says is likely to happen next.
The account and the company behind it
The account belongs to a mid-sized software company that runs a mix of customer-facing services and internal platforms on AWS. Its stack is probably familiar if you work in a growing tech org: containerized services on ECS/Fargate, a DocumentDB cluster, ElastiCache, RDS, an Application Load Balancer, AWS Transfer Family, and the standard security and compliance tooling (GuardDuty, CloudTrail, Config, KMS, Secrets Manager). Nothing exotic, nothing hyperscale — just a working AWS account where a small platform team is keeping a lot of services running.
Like many teams, they do not have a dedicated FinOps person. Costs drifted as projects shipped, prototypes ran, and experiments ended. By the time the monthly bill became uncomfortable, the waste was spread across a dozen services, and no single Cost Explorer view showed the whole picture clearly.
When we ran the first npx greenops-scan, the account was already billing $7,726.20 for the month, with the two largest line items being ECS ($3,235.93) and DocumentDB ($1,506.78).
The account's real Cost Explorer history: a near-continuous climb from about $2,000/month in late 2023 to nearly $7,800/month by mid-2026. The last bar is AWS's own forecast (marked with ** and an 80% prediction interval) for the following month — not a confirmed result, but a trend AWS's own model expects given recent changes to the account.
What the first scan found
... Read more: https://greenops.cloud/blog/blog-cost-drop-8k-to-6k
If your team wants continuous monitoring after the one-off scan, GreenOps Cloud adds automated recurring scans, shared dashboards, and trend tracking.
https://greenops.cloud/?utm_source=producthunt&utm_medium=launch-listing&utm_campaign=greenops_launch_2026q3&utm_content=ph-main