Monchart: Instantly turn HTML tables into charts! ✅ Auto-detect & convert tables ✅ Works with grids & standard tables ✅ Y-axis filters for refined data 🔒 Unlock premium: save, analyze, export & share charts. 🚀 Free to use—upgrade for more!
No reviews yetBe the first to leave a review for Convert HTML Tables into Charts
Maker
📌
Hey Product Hunters! 👋
I'm Viktor Osetrov, the creator of Monchart, and I'm excited to bring this powerful Chrome extension to you all!
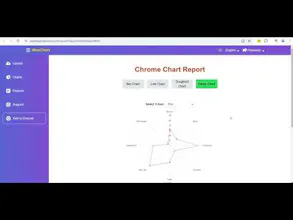
Monchart instantly converts any HTML table into interactive charts: whether it's a basic table or a complex grid, just a few clicks and you’re done! No more copying data to Excel or struggling with manual charting.
Why This Pivot?
After launching Monchart as a standalone data visualization tool, I received amazing feedback from early users. One thing was clear - people wanted a more seamless, browser-based experience without the hassle of uploading files. So, I pivoted to a Chrome extension that works directly on web pages.
What’s Inside? (Free & Premium Features)
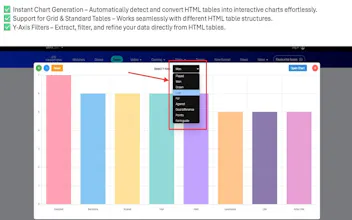
✅ Instant Chart Generation – Convert tables into charts effortlessly.
✅ Works with Any Table Structure – Standard tables, grid-based layouts, and more.
✅ Y-Axis Filters – Easily refine and analyze your data.
🔒 Advanced Features for Authorized Users (Saved Charts & More):
- Multiple chart types: bar, line, doughnut, radar and more.
- Save & analyze charts anytime.
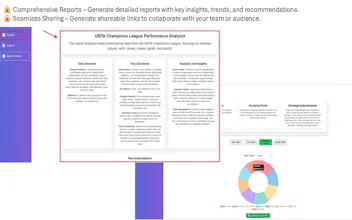
- Generate detailed reports with AI-powered insights.
- Unlimited storage & high-quality exports.
- Seamless sharing via links.
Next Steps & Roadmap
- I’m now focusing on integrations with other products and enhancing data analysis with more filters, instruments, and libraries. Expect deeper analytics, advanced charting options, and smarter tools soon!
Your Feedback Helps Monchart Grow!
I’d love to hear your thoughts! What works well? What could be better? Honest feedback helps shape the future of Monchart. Let’s build something great together!
🚀 Try it out & let me know what you think!
Viktor