Launching today

ClawMetry for OpenClaw
Real-time observability dashboard for OpenClaw AI agents
153 followers
Real-time observability dashboard for OpenClaw AI agents
153 followers
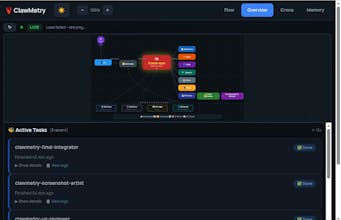
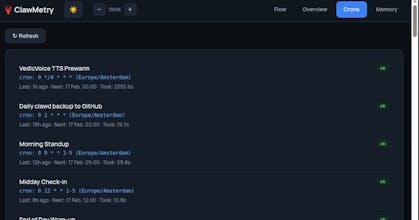
ClawMetry is a free, open-source observability dashboard for OpenClaw AI agents. Think Grafana, but purpose-built for AI. One command install (pip install clawmetry), zero config. Monitor token costs, sub-agent activity, cron jobs, memory changes, and session history. All in real-time with a beautiful live flow visualization. Works on macOS, Linux, Windows, even Raspberry Pi


Observability for AI agents is something most builders overlook until things break in production. Love that you're tackling this early. How do you handle tracing when agents make multiple chained calls? In my experience building database agents, the hardest part to debug is when the agent interprets a query correctly but chains the wrong follow-up action. Clean dashboards for that would be a game changer.
@saezbaldo Great question, Damian. Tracing chained agent calls is exactly where most logging tools fall short.
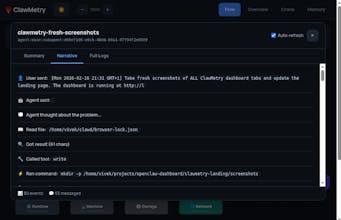
ClawMetry tracks every tool call, sub-agent spawn, and session handoff with full context. So when agent A calls agent B which queries a database and picks the wrong follow-up, you can trace the entire chain: what each agent saw, what it decided, and where it went wrong.
The cron management dashboard also helps here. You can see scheduled tasks, their run history, and drill into individual executions. No more guessing which step broke.
We're actively building deeper tracing for multi-agent workflows. Would love your feedback if you try it out: pip install clawmetry and you're up in 30 seconds.