
Canopy Charts
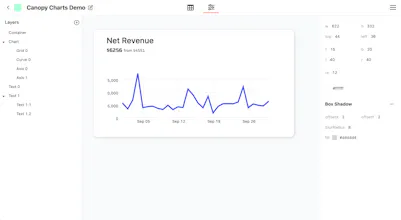
Visual editor for building beautiful, dynamic charts
5 followers
Visual editor for building beautiful, dynamic charts
5 followers
Canopy Charts provides a visual editor for quickly building and customizing beautiful charts. The charts can be embedded in a live app like a React app, or any web page by using an iframe. The charts are powered by live data from a variety of sources.



Free Options
Launch Team

Render Sandboxes: a computer for every agentGive every agent its own machine. Starts in under a second
Promoted

 Canopy Charts

 Customer Success job board
