Buydy
Heat maps and ETF screeners with sector percentiles
1 follower
Heat maps and ETF screeners with sector percentiles
1 follower
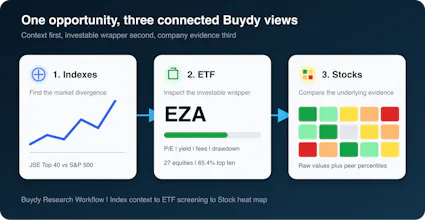
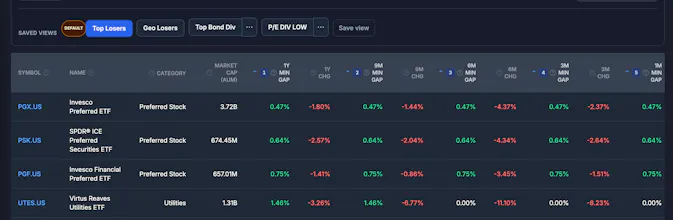
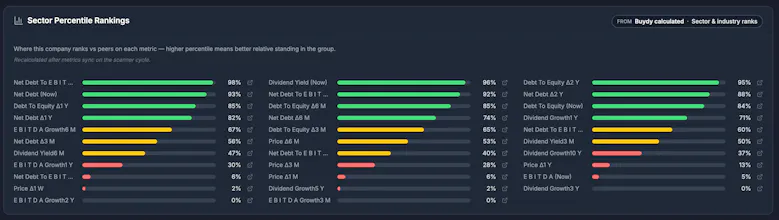
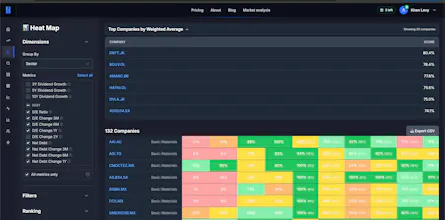
Buydy is a research workspace for stocks and ETFs, not a broker or signal service. Screen 4,000+ large caps with heat maps that show sector and industry percentiles, not just green/red tiles. Compare ETFs side by side, save screener layouts, and monitor global indexes from one dashboard. Built for investors who outgrew Finviz-style maps but still want a fast workflow without rebuilding spreadsheets every week. 90-day free trial at app.buydy.co. No card to start. Subscribe when ready.