Upload your DeGiro, Trading 212, IBKR, eToro or Robinhood export and see if you're actually beating the S&P 500. No broker login, all brokers in one dashboard, from €5.99/mo.
For years I tracked my own dividend portfolio in a messy Excel sheet built on top of my DeGiro exports. It worked, but it never answered the one question I actually cared about: was I beating the market, or just breaking even after fees?
I tried a few paid tools, but none of them combined proper multi-broker support with a real benchmark comparison against the S&P 500 or Nasdaq. That is why I built BullBenchmark.
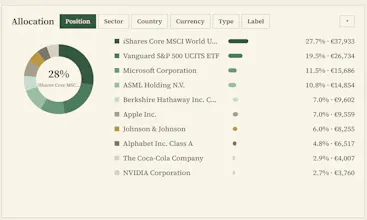
You upload your transaction exports (DeGiro, IBKR, Trading 212, and more brokers on the way), and it shows your true return after fees, every dividend metric worth tracking (yield, yield-on-cost, CAGR), and a What-if view: what your money would be worth today if it had gone into the S&P 500 instead.
No spreadsheets, no manual updates, no guessing. I built it for myself first, and I'm sharing it now because I'd have wanted this two years ago.
Would love your feedback, especially on which brokers to support next.