Launching today

Bubble Or Not?
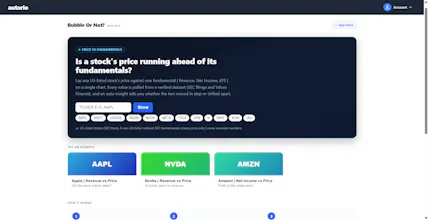
Is a stock overvalued? Chart its price vs fundamentals
3 followers
Is a stock overvalued? Chart its price vs fundamentals
3 followers
Is a stock overvalued, or is its price backed by real fundamentals? Bubble Or Not? overlays any US-listed stock's price against Revenue, Net Income, or EPS on a single chart. Flip to an indexed view to watch price pull away from the numbers, plus a plain-English auto-insight that flags multiple expansion. Free, no signup. Every figure verified from SEC EDGAR + Yahoo Finance | nothing invented.


Hey Product Hunt!
Every few weeks I'd see a headline asking whether NVDA, PLTR or the whole market is "in a bubble" — but actually checking that meant digging through paid terminals or stitching screenshots together. I wanted a single chart that answers one question: is this stock's price backed by its fundamentals, or running ahead of them?
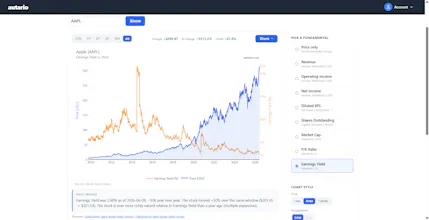
So I built Bubble Or Not? You type a US ticker, pick a fundamental (Revenue, Net Income or EPS), and the price and that fundamental land on one chart.
What I think makes it genuinely useful:
- An indexed (=100) view that normalizes both lines, so price pulling away from the numbers jumps out instantly
- A plain-English auto-insight
- Every figure is verified from SEC EDGAR + Yahoo Finance
It's completely free - even without signup.
Try a ticker you're curious about (NVDA and PLTR are eye-opening) and tell me what you think - especially which other fundamentals or metrics you'd want to overlay next.
Thanks for taking a look!