AngularJs Profiler

Identify which code is executed in your AngularJs app easily

0 followers

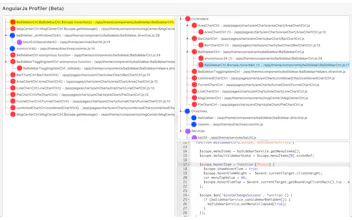
Helpful to debug a web app or identify which Controller, Directive, Service, etc. are called. It shows the called functions, their components and where those are located in their respective source files.
AngularJs Profiler gallery image
Launch Team
Anima - Vibe Coding for Product Teams
Build websites and apps with AI that understands design.
Promoted

What do you think? …

Marco Chávez
Hi everyone, I’ve been working in a company that has projects in AngularJs (Angular 1.x), and sometimes is difficult to identify which modules/functions are called in a specific action (particularly when I have to fix a bug). That’s why I created this tool to profile AngularJs apps. Just install the chrome extension, press the record button, interact with your web app, and press “Stop” to show the executed code from that interaction. I’d love to hear your feedback, and answer any questions you may have :) Thanks,