Transplant.to

An interactive website showing where people are moving & why

3 followers

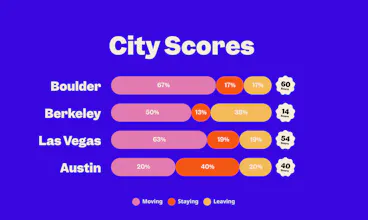
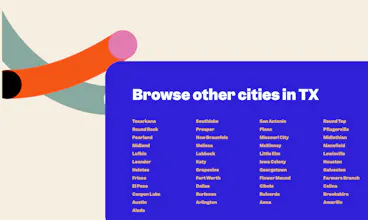
Discover the top cities where people are transplanting. πŸŒ‡ The best new cities to move to πŸ“ˆ See how your city stacks up πŸ“Š City by city comparisons πŸ—ΊοΈ Interactive Maps
Transplant.to gallery image
Launch tags:User Experienceβ€’Tech
Launch Team
Intercom
Intercom
Startups get 90% off Intercom + 1 year of Fin AI Agent free
Promoted

What do you think? …

Caleb Barclay
Hi PH πŸ‘‹ Thanks for the hunt @moeamaya ! Transplant was an idea birthed out of Sam Parr's Tweet that surveyed over 4k people with two questions: 1) Are you moving 2) Why. @ianjanicki and I built a site that visualizes those responses (w/ no-code). With so many people WFH, many are leaving expensive cities and moving to more affordable, and higher square footage, homes (see the San Francisco page). We'd love to get a more comprehensive data set so feel free to fill out the form and share your plans for moving / staying. We'll be updating the site with the new responses. As always, we'd love to know what you think!
Ilya Belikin
@moeamaya @ianjanicki @calebarclay the form asking if I am moving do not accept names of two biggest global cities as valid, something is a bit off with validation. I would love to see this project scaling and covering Hong Kong! It would be wonderful to capture not only where but when people plan to move - in HK I see a lot of people dependent on the contracts, so they would plan a year ahead. Seeing this data would be amazing.
Chris Messina
@moeamaya @ianjanicki @calebarclay this chart blew my mind β€” so this is well timed!
Ian Janicki
@chrismessina Once we saw the open data Sam put out there (see link below), @calebarclay & I immediately said, we had to build this! What else would you like to see in the product? https://docs.google.com/spreadsh...
Myron Shneider
@moeamaya @ianjanicki @calebarclay super cool project. Love seeing Trends data be out to good use. What no-code tools did you use to make this? The visuals are πŸ”₯
Ian Janicki
@myron_shneider Webflow+Airtable+Parabola (with a side of custom JS + Leaflet for the maps)
Rodrigo Gomez-Palacio
This is awesome. I hope this gets updated regularly with fresh data. I'm interested to see how this changes over time
Ian Janicki
Thanks @rgomezp. What else would you like to see in the product?
Rodrigo Gomez-Palacio
@ianjanicki I think it would be helpful to have some graphs that show how the percentages change over time for each city. Also, you may be doing this already but I think it should be based on a moving time-window over the data so that stale responses are weighted less or not at all. Or add the ability to select "past month", "past 6 months", etc...
Ian Janicki
@rgomezp Love this. If we can get statistically-significant data over time we should be able to make this happen!
Sandoche
Is it only for US cities?
Caleb Barclay
@sandochee So far, the survey responses have predominantly been US cities but the more responses from different parts of the world, the more cities will be updated on the site.
Ian
@sandochee @calebarclay My city isn't valid, so I couldn't add a move/stay/leave.
Ilya Belikin
@sandochee @calebarclay @ianmayman stumbled on the same, and it is not clear from the UI. Is it Hong Kong is not valid?
Ian Janicki
@ihrd I got it to work, could you try it again?
Ian
I like the idea, but like so many online things, it's U.S only, so my location was deemed not valid. It's interesting that New York is both the top place to move to and to leave!
Miguel Rodriguez
What a great idea! I can see how this can be a great source of interesting data. Good job!
Carmen Martin
Will for sure give it a try! Sounds interesting
Nic Acton
Could the maker be a little more transparent with where the data is coming from? One might mistake it as a visualization that is indicative of comprehensive demographic patterns.
Ian Janicki
@nic_acton We put our sources in the footer of all of pages. Do you think it could be more clear?
Nic Acton
@ianjanicki All meant respectfully and constructively: So you say your sources are Trends and The Hustle. That would be like saying your source is Wikipedia. Both of those sources are also paywalled and the details are obscured. What specific data from either of those sources are you using? How does data from either of those sources hold authority or confidence in the domain you're attempting to tackle? Why should I have any confidence that the data from either of those sources is indicative of "showing where people are moving and why"?
Ian Janicki
@nic_acton Hey Nic, thanks for the feedback. For full transparency, here is the original data, it is fully public and available: https://docs.google.com/spreadsh... We put a lot of work into categorizing and geocoding this data, and hopefully we can open-source that data in the future! Obviously this is non-scientific data β€”Β this is merely based on a survey with several thousand entries and biased to those who read The Hustle β€”Β make your own assumptions on what that demographic looks like. We are open to other sources if we feel they could convey: Directionally, what are the moving trends in 2020. There are a lot people making unexpected living choices based on many trends this year, and this was the best data we had come across.
Nic Acton
@ianjanicki So the data is derived from the survey form at the bottom right of the page, and presumably you included a survey in a copy of Trends and The Hustle newsletter in the early phases of this product? I could not follow any of that based on any links or documents on the site itself. That all seems fine, and data that isn't necessarily indicative of a broad stroke of the overall population can still be valuable, but I would say everything you just said is not "provided by trends.co and thehustle.co". As an aside, appreciate the data. I think the value will be less in the "how many people are moving" but more some NLP into the "why?" That's a component that other datasets will be missing.
12
Next
Last