

PropTrenz
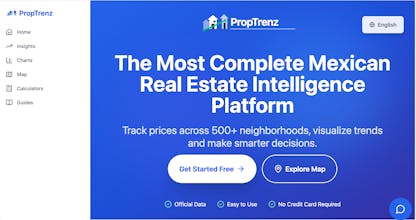
Track property price across 500+ neighborhoods across Mexico
2 followers
Track property price across 500+ neighborhoods across Mexico
2 followers
After seeing the lack of accessible transparent real estate data in Mexico, and going through the pain of trying to buy property in Mexico myself, I built a tool that provides: • 20+ years of historical price data, track prices across 500+ neighborhoods • Interactive charts and visualizations to understand the market • Accurate calculators to uncover hidden costs nobody will tell you • Guides that educate you better than your agents • Multi-language support Time to make informed decisions!


**What inspired me to build this?**
A few years ago, I was looking to buy property in Mexico and hit a frustrating wall: reliable, neighborhood-level price data was nearly impossible to find. Real estate agents had their own numbers, websites showed outdated listing prices, and government data existed but was buried in complex files that nobody could decipher.
I realized this wasn't just my problem—it's a systemic issue affecting millions of people making one of the biggest financial decisions of their lives. Whether you're a first-time buyer, investor, local or foreign, you deserve transparent, accessible data to make informed decisions.
**What problem am I trying to solve?**
PropTrenz solves three core problems:
1. **Data Accessibility**: Besides the big listing websites(inmuebles24.com etc. just listing sites for sellers), there's virtually no other tool exists that gives buyers an unbiased view of the market. I built this site using official unbiased data, and transformed it into interactive, visual insights anyone can understand.
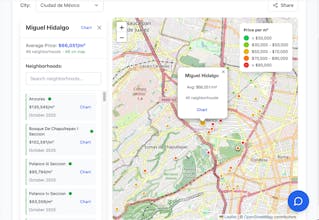
2. **Granularity Gap**: Most platforms show city or state averages, but real estate is hyperlocal. A neighborhood 2 blocks away can have completely different price dynamics. We provide neighborhood-level data with monthly updates, so you can see exactly what's happening in the areas you care about.
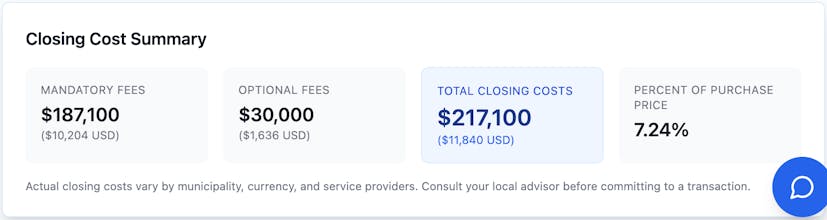
3. **Hidden Costs**: Beyond the listing price, buying or selling property involves taxes, fees, and other costs that can add up significantly. Our calculators help you understand the true cost before you commit.
**How did your approach or process evolve while working on this launch?**
The journey has not been a smooth sailing. Initially, I thought this would be a simple data visualization tool. But as I talked to users, I realized they needed more:
- The Map Feature: Users wanted to explore visually, not just search. So we built an interactive map where you can see price patterns across entire cities, click through municipalities, and drill down to neighborhoods—all with color-coded markers showing price ranges at a glance.
- Shareability: Real estate decisions are collaborative. We added shareable links that preserve your exact view (selected location, charts, etc.), so you can easily share insights with partners, friends, or clients.
- Multilingual Support: Mexico's real estate market is global. We added multilingual support from day one, so it's accessible to everyone.
- The Calculator Evolution: What started as a simple price tracker evolved into a comprehensive decision-making tool. Users told us they needed to understand total costs, not just prices, so we built calculators for hidden fees, taxes, and transaction costs.
The biggest learning? Start with the data, but build for the user journey. Real estate decisions are emotional and financial — people need tools that respect both. Every feature we added came from understanding how people actually research and make decisions.
We're just getting started! Would love to hear your feedback, especially if you're exploring the Mexican real estate market. What features would make this more useful for you?