Grafieks

Grafieks

Data In. Insight out.

77 followers

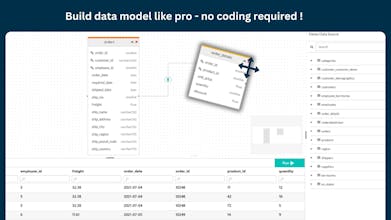
Grafieks is an AI-powered BI platform that lets you explore real-time and historical data effortlessly. With Grafieks, you can easily connect to your data sources, create custom models, and generate detailed reports with ease. Use powerful data filters to refine insights and set near-real-time alerts to stay informed about critical changes. Grafieks enables you to make data-driven decisions faster, leveraging real-time insights to stay ahead and respond proactively.
Grafieks gallery image
Free Options
Launch Team
Flowstep
Flowstep
Generate real UI in seconds
Promoted

What do you think? …

Hirak Kocharee
Hi everybody 👋, my name is Hirak, co-founder of Grafieks 📊🚀 🌟 Introducing Grafieks Real-Time Analytics It is with immense excitement that we unveil Grafieks Real-Time Analytics, the latest feature update from Grafieks – a platform designed to redefine how businesses engage with their data. What is Grafieks? Grafieks is a user-friendly self-service unified analytics platform built to simplify data visualization and analysis. By combining batch data analytics with real-time streaming capabilities, Grafieks enables users to gain immediate, actionable insights while maintaining the depth of historical data analysis. With the introduction of Real-Time Analytics, Grafieks now empowers its users to monitor data as it unfolds, ensuring they stay informed and agile in their decision-making. Why Grafieks? "Another BI tool?" you ask. Here’s why Grafieks is different: 1. Affordable SaaS BI: Designed to democratize data analysis, Grafieks ensures powerful analytics capabilities are accessible to everyone, whether you're a solo entrepreneur or part of a large team. 2. Unified Batch and Real-Time Analytics: Seamlessly integrate historical data insights with real-time streaming analytics to make well-rounded, informed decisions. 3. Intelligent Data Alerts: Leverage an advanced alerting system that proactively notifies you of critical trends, anomalies, or threshold breaches in near real-time, empowering you to act swiftly. So, is it like Grafana, Tableau, or Power BI? "It’s more than just another tool. Grafieks merges the intuitive, user-friendly visualizations of platforms with dynamic, real-time streaming capabilities. The result? A powerful hybrid platform that excels in both operational monitoring and strategic decision-making." What’s New? The latest release of Grafieks is more than an update – it’s a revolution in reporting. This version introduces the ability to seamlessly integrate real-time data streaming with batch data analytics, opening doors to previously unattainable insights. With Grafieks, you can: ✔️ Detect trends in real-time. ✔️ Identify patterns buried in historical data. ✔️ Receive proactive alerts to act on key insights. ✔️ Confidently make data-driven decisions with comprehensive insights. Why wait? Take the next step in data analytics and discover how Grafieks can transform the way you engage with your data. Create your free account—yours forever! We’d love to hear your thoughts, feedback, and ideas.
Abhishek Sontakke
Congratulations on the launch of Grafieks! Hirak and Ravi! 🎉Grafieks has huge potential to capture market share in the data visualization space. The real-time streaming can truly empower organizations to make more informed, timely decisions. Wishing you continued success with this product! ✨ Excited to see how Grafieks will help businesses unlock the full potential of their data. 🌟
Hirak Kocharee
@abhishek3008 Thank you