
Launched this week

DataShift Visual
A simpler way for labs to manage QC control charts
3 followers
A simpler way for labs to manage QC control charts
3 followers
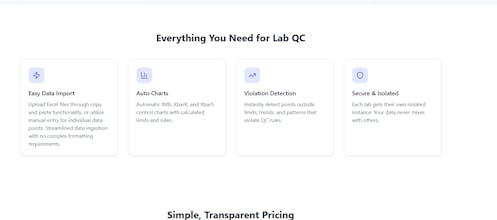
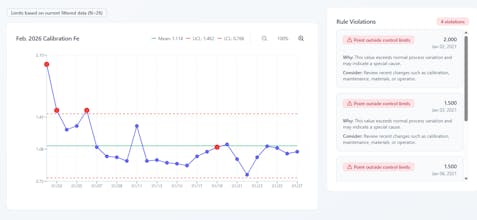
Datashift Visual helps labs upload QC data, automatically generate control charts, and flag rule violations—without having to manually create them in Excel.


Another reason i built this; over 13 years working in the Lab, I've seen specific gaps. I noticed working with IC's, ICP, AAS and many other analytical instrumentations. We would eventually have errors with the equipment. Affecting our measurement precision and accuracy of results. This would lead to changing columns. pumps, tubing and other repairs.
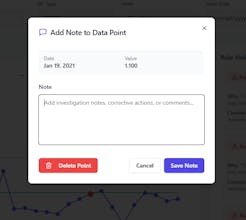
Analytical equipment has QC measurements that can be monitor. Control charts allow labs to monitor daily, weekly and monthly shifts or drifts. Most are created within excel. We hardly had any time to do that. Busy doing analysis. This software generates control charts automatically, once data is copied and paste. Saves time, allows labs to stay on top of equipment performance, creates a smooth process for quality investigations and more.