Aha!
The world's #1 product development software
118 followers
The world's #1 product development software
118 followers
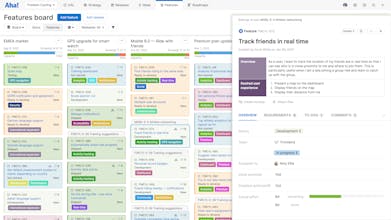
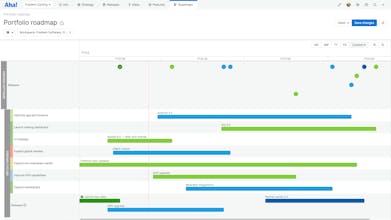
Our suite of tools work together to help teams turn raw concepts into valuable new capabilities — for customers and the business. Set strategy, crowdsource ideas, spark creativity, prioritize features, share roadmaps, manage releases, and plan development.