MonChart

Transform data files into charts & detailed reports

17 followers

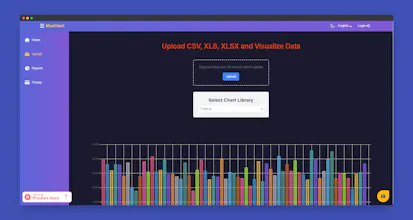
MonChart: Instantly transform raw CSV, Excel, JSON files into stunning charts and detailed reports with just a few clicks. Explore diverse chart types, apply powerful filters, and detailed reports. Perfect for insights and presentations.
Interactive
MonChart gallery image
Free Options
Launch Team / Built With
Intercom
Intercom
Startups get 90% off Intercom + 1 year of Fin AI Agent free
Promoted

What do you think? …

Viktor Osetrov
Hello Product Hunters! 👋 I'm Viktor Osetrov, a 36-year-old male, 2 kids, living and working in Ireland. After six years away from the startup world (during which I worked in the "navy" of the corporate world), I’m thrilled to be back as a solopreneur and indie hacker. Today, I’m launching MonChart, a tool that transforms raw CSV/Excel files into stunning charts and deep data analytics reports. 🚀 Why I Built This: Data is the king, but let’s face it -> raw data is overwhelming. While tools like Excel are powerful, they often require specialized knowledge, and advanced analytics software can be too expensive. I wanted to create a simple, affordable solution for everyone to unlock insights from their data ->quickly and easily. With MonChart, you can: - Drag and drop your CSV, XLS, XLSX files up to 10MB to get instant insights. - Visualize data beautifully with libraries like D3.js and Chart.js. - Categorize and group data intelligently with tools like PapaParse and my custom filters. - Generate professional-grade reports using the latest Gemini AI model. The Tech Behind It: Built on a classic MERN architecture (MongoDB, Express.js, React.js, Node.js), MonChart ensures a seamless user experience. Future updates will expand file support and integrate more advanced libraries like NumPy, SciPy, Pandas, Matplotlib, and Plotly to handle complex datasets. Pricing: - Free Trial: 7 days, no credit card required. - Pay-as-you-go: $1.99 per report with granulated charts. - Unlimited Access: $7.67/month or $69/year. My Next Steps: I plan to: - Increase file size limits from 10 MB to 1 GB. - Add support for more file types. - Incorporate advanced libraries for deeper data analysis. Let’s Chat: I’d love for you to try the product and share your thoughts. Your honest feedback is invaluable as I continue to improve and grow this platform. Feel free to ask questions, suggest features, or just say hi in the comments. Thank you for checking out MonChart -> I can’t wait to hear what you think! 🙌 Cheers, Viktor Osetrov
Arman Murzabulatov
💡 Bright idea
MonChart is an incredible tool that simplifies working with raw data. I love how easy it is to turn CSV or Excel files into beautiful charts and detailed reports in just a few clicks. The drag-and-drop feature is super intuitive, and the pricing is very reasonable for what it offers. This is a must-have for anyone who wants quick insights without the hassle of complex software. Great work, @viktor_osetrov —excited to see how MonChart evolves!
Viktor Osetrov
@kz_arman thank you very much Arman for your feedback! 🎉The next step will be integrating more powerful data visualization libraries. 🥳
Blair
MonChart is an amazing tool that makes working with raw data a breeze. I really appreciate how effortlessly it transforms CSV or Excel files into stunning charts and comprehensive reports with just a few clicks. The drag-and-drop functionality is incredibly user-friendly, and the pricing is quite affordable given its capabilities. It's definitely a must-have for anyone seeking quick insights without the complexity of more advanced software.
Viktor Osetrov
@dejavideos thank you very much Blair 📊🌻