Datuum

Datuum

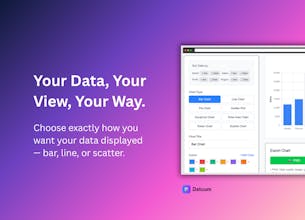
Visualize Data...Your way

5 followers

Datuum is a simple web app that makes data visualization effortless. Upload your dataset, choose how you want it displayed, and generate clean, customizable charts in seconds β€” bar, line, or scatter, all in one place. No sign up needed
Datuum gallery image
Free
Launch tags:Productivityβ€’Analyticsβ€’Data Visualization
Launch Team
Intercom
Intercom
Startups get 90% off Intercom + 1 year of Fin AI Agent free
Promoted

What do you think? …

Mitch
Maker
πŸ“Œ
Hello PH gang! I’m excited to share Datuum, a simple data visualization tool I built to make working with datasets less frustrating and more accessible. Your support and feedback mean a lot β€” this project started as something I needed myself, and I’m thrilled to finally open it up to others! Why did I build Datuum? πŸ› οΈ As a student and developer, I constantly had raw datasets I wanted to explore β€” but the tools out there were either too complex, required coding, or felt like overkill for quick visualization. I wanted something lightweight, fast, and flexible. With Datuum, you can turn a CSV into clean, customizable charts in seconds without extra setup or steep learning curves. How does it work? πŸ“‚ Upload your dataset β€” no formatting headaches, just a simple file upload πŸ“Š Pick your view β€” bar, line, or scatter chart options ready to go ⚑ Customize instantly β€” adjust how it looks to match what you need 🌐 Access anywhere β€” simple web app, no downloads or installs required What’s next? This is just the beginning! I’ll be adding more chart types, improved customization, and better ways to share your visuals. Feedback is super welcome β€” tell me what would make Datuum even more useful for you. Thanks for checking it out, and I can’t wait to hear what you think πŸ™Œ